Saad Ullah

Bitcoin traders are paying close attention to a key technical indicator that's been remarkably reliable over the years. The Chande Momentum Oscillator has just flashed a warning sign that historically has marked major turning points in Bitcoin's price cycles. With BTC trading around $108,840, this development could be more significant than it first appears.
Bitcoin (BTC) Price Faces Momentum Breakdown
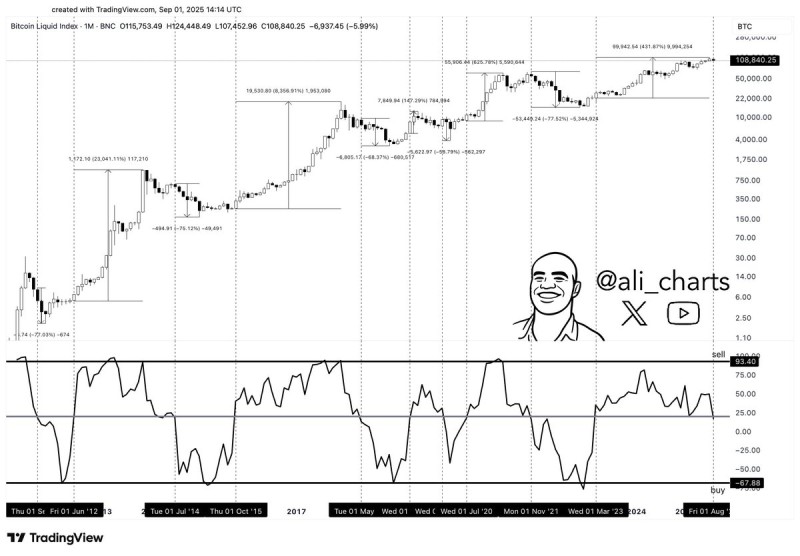
For more than ten years, the Chande Momentum Oscillator has been a go-to tool for tracking Bitcoin's big picture moves. When it climbs above 20, it usually means the bulls are taking charge for the long haul. When it drops below 20, well, that's when things often get interesting for bears.
Trader @ali_charts recently highlighted that August's close confirmed the drop below this crucial 20 level. With Bitcoin still sitting around $108,840, the market is basically split between those hoping for a quick bounce back and others bracing for a bigger pullback.
Historical Patterns in BTC Price Cycles
Looking at Bitcoin's track record, the pattern is pretty clear:
- Back in 2013 and 2017, when the CMO pushed above 20, Bitcoin went absolutely ballistic with those legendary bull runs we all remember.
- But when it dropped below 20, things got ugly fast – we're talking multi-month bear markets with corrections of 50% or worse.
This time around, Bitcoin has already pumped over 430% from its cycle lows before hitting this momentum wall. That makes this signal especially worth watching.
What Comes Next for BTC Price?
If history is any guide, Bitcoin's drop below 20 might mean we're in for a cooling-off period. The big support level everyone's watching is around $100,000, while Bitcoin would need to reclaim $120,000 to get the bulls excited again.
The big question now is whether this is just Bitcoin taking a breather or if we're looking at the start of something bigger. The next few weeks should give us a clearer picture of whether this bull market still has legs or if it's time to buckle up for a rougher ride.
 Saad Ullah