Saad Ullah

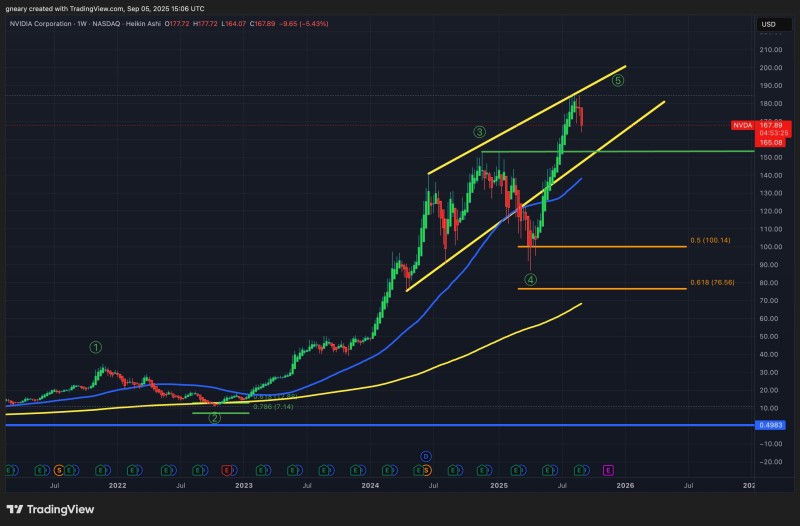
Nvidia (NVDA) continues its impressive run, but technical indicators are flashing warning signs. As the stock pushes deeper into what appears to be Elliott Wave 5 territory, seasoned traders are weighing whether to take profits or ride the trend higher. With NVDA down 5.43% this week, the question becomes: is this just a minor pullback or the start of something bigger?
NVDA Price Extends Into Wave 5
Nvidia has been on an incredible journey, climbing to $167.89 as it moves through what technical analysts identify as Wave 5. This stage of the Elliott Wave cycle often marks the final push of a major trend before a significant correction takes hold.
Trader @TheLongInvest points out that while the overall bullish structure remains solid, Wave 5 is typically where smart money starts getting nervous.
Late-stage rallies can be deceiving – they often feel the strongest right before they reverse. The current weekly decline of 5.43% might be the first sign that momentum is starting to crack.
Historical Context: NVDA's Volatile Past
This isn't uncharted territory for Nvidia investors. The stock has shown us before just how quickly sentiment can shift. Back in late 2024, NVDA was sitting pretty near $150, giving bulls plenty of confidence. Fast forward a few months, and the stock had crashed to $85 – a brutal reminder that even the hottest AI darling isn't immune to market cycles.
Key Technical Levels Coming Into Focus
The charts are telling an interesting story right now. The 200-week moving average is steadily climbing toward the 0.618 Fibonacci retracement at $76.56, creating what could become a powerful support zone if bears take control. Meanwhile, the 0.5 Fibonacci level at $100.14 is sitting there like a magnet, potentially attracting buyers if we see a meaningful correction.
Current price action shows NVDA struggling to maintain its upward trajectory, with $150 emerging as a critical support level to watch.
Risk Management in Uncertain Times
Smart traders aren't just looking at the upside anymore. The risk-reward equation is shifting as NVDA trades at these elevated levels. A break above $180 could spark another leg higher, but the probability of a pullback is increasing with each passing day.
For long-term investors, the $100-80 range is looking increasingly attractive as a potential re-entry point. It aligns with historical retracement patterns and provides a much better margin of safety than current levels. The rising 200-week moving average adds another layer of confidence to this potential support zone.
 Saad Ullah