 Peter Smith

Amazon just got a reality check from the CPI report, but here's what really matters - the stock is sitting right on top of a trendline that's been working like clockwork since April. We're talking about an ascending triangle pattern that's had AMZN climbing steadily while bumping its head against the $243-244 ceiling over and over.
What the Chart is Screaming
Trader Shaun Trades called yesterday's action "fair" given the inflation noise, but today's the real test.
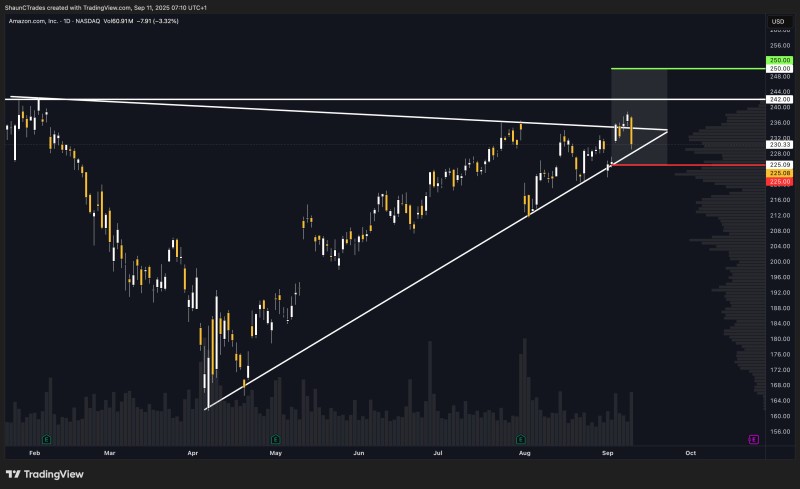
The daily setup tells a pretty clear story. Amazon's been riding this rising support line like it's on rails, and right now that magic zone sits around $228-230. Here's what traders are watching:
- The Make-or-Break Level: That trendline support at $228-230 has been Amazon's safety net. Lose it, and things get interesting fast
- The Ceiling: $243-244 has been like kryptonite for the stock. Break through there, and $250 starts looking real
- The Backup Plan: If everything falls apart, $225 is where the cavalry showed up before
- Volume Story: The smart money seems to be buying every dip, which usually means something good is cooking
The Big Picture Drama
This isn't happening in a vacuum. The Fed's playing inflation whack-a-mole, and tech stocks like Amazon are caught in the crossfire. But here's the thing - Amazon's got two engines firing: e-commerce is humming along, and AWS keeps printing money. That's been enough to keep the bulls interested, even when the macro picture gets messy.
The bottom line? Amazon's sitting at a crossroads. Hold above $230 and push through $243, and we're probably looking at a run to $250. Fail here, and that $225 level becomes the new battleground. Either way, this trendline is about to tell us everything we need to know about where AMZN heads next.
 Peter Smith


