 Eseandre Mordi

⬤ EUR/USD now trades between 1.1600 and 1.1620 after it retreated from 1.1650. The candles have small bodies plus the daily range stays thin, which shows traders lack conviction while they wait for a signal. The rising trendline that began in early April still holds - the medium term view stays positive.
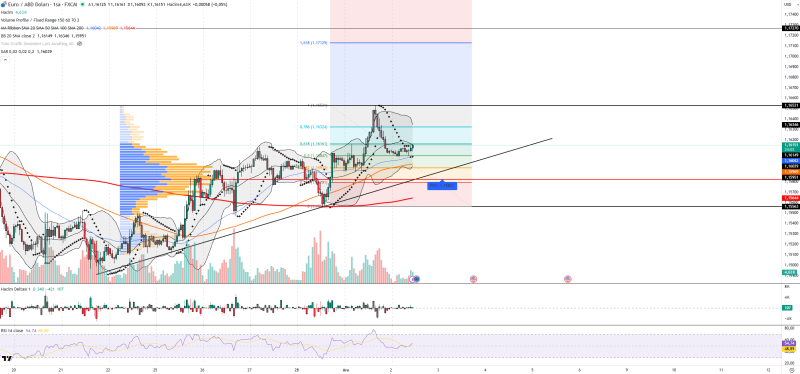
⬤ The indicators give a neutral-to-bullish read. RSI rests at 54, a level that signals balanced force with a mild upward lean. Volume is low which means few traders back either side. The Volume Profile places its Point of Control at 1.1582; that price coincides with one of the main support zones. Bollinger Bands contain price as it drifts along the midline. Parabolic SAR dots have printed just above the candles, a placement that warns of light downward pressure in the near term.
⬤ Support rests at 1.1603 then at 1.1595 and 1.1582. Resistance waits at 1.1634, followed by 1.1653 but also 1.1729. Fibonacci retracements at 1.1616 and 1.1632 overlap those barriers. On the policy side, investors still expect the Federal Reserve to lower rates later this year, a view that weighs on the dollar. The European Central Bank keeps a guarded tone. United States inflation as well as payroll figures due this week will probably decide the pair's path and risk appetite looks evenly balanced ahead of those prints.
⬤ EUR/USD now compresses into a tight band while the larger uptrend survives. A breakout from this coil may produce a fast move. The reaction to the data releases could reset rate forecasts or shift mood across the currency market. With key technical levels set and macro cues in view, the next swing should show whether the pair climbs toward 1.1729 or slides back to test the 1.1582 area.
 Eseandre Mordi


