 Saad Ullah
Stellar (XLM) shows potential for a significant market breakout against Ripple's XRP, with Bollinger Bands signaling an impending price movement that could reshape the cryptocurrency landscape.
The Rise of XRP and Stellar: A Comparative Journey
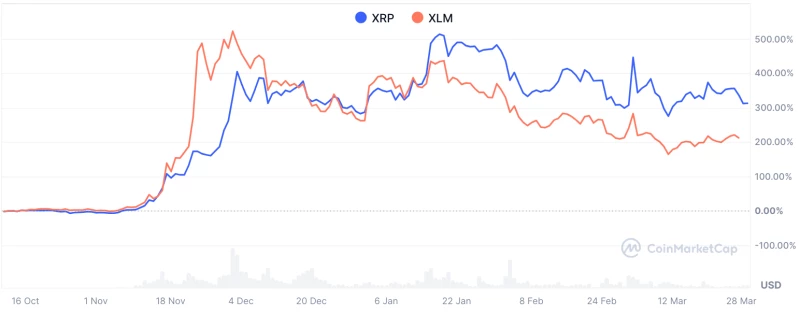
In the dynamic world of cryptocurrencies, XRP has once again captured the market's attention, surging an impressive 500% and outperforming Bitcoin (BTC). This remarkable performance has not gone unnoticed, with numerous renowned institutions filing for an XRP Exchange Traded Fund (ETF) and the coin featuring prominently in discussions about the U.S. Digital Asset Stockpile.
Yet, amid the XRP mania, another cryptocurrency has been quietly making significant waves - Stellar (XLM). Since November, XLM has demonstrated an even more remarkable trajectory, skyrocketing 600% and climbing from $0.09 to $0.63 in just a few short weeks.
The Unique Origin: Jed McCaleb's Cryptocurrency Twins
What makes the XRP and XLM story particularly fascinating is their shared genesis. Both cryptocurrencies were created by the same visionary, Jed McCaleb, but with distinctly different missions. While XRP positions itself as a business-oriented solution, XLM is designed with individual users in mind.
This nuanced difference becomes evident when examining their market performance. For instance, in November, XLM outperformed XRP by a staggering 173%, offering savvy investors opportunities that many overlooked while focusing solely on XRP.
Market Dynamics: XLM's Rollercoaster Performance
Following its impressive November surge, Stellar experienced a significant pullback, losing 70% of its value against XRP in recent months - a typical pattern for beta assets in the cryptocurrency market. However, the current market indicators suggest this might be about to change.
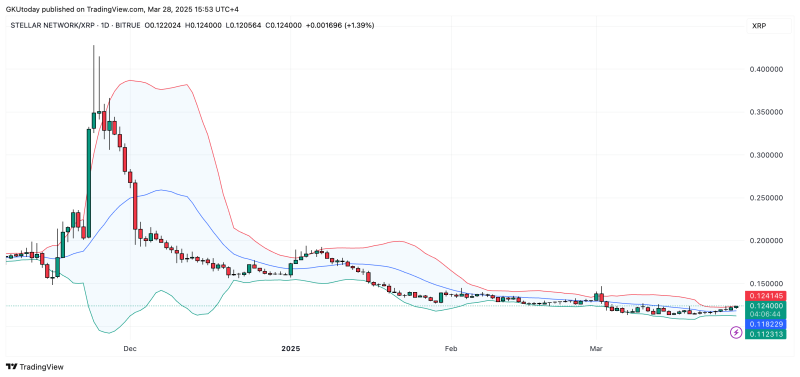
The XLM/XRP ratio, when analyzed through technical indicators like Bollinger Bands, reveals an intriguing possibility. The bands are signaling a potential major squeeze, with Stellar breaking out of a tight range above the upper band. Historical patterns suggest this could be a precursor to another significant move by XLM.
Technical Analysis: Reading the Bollinger Bands
Bollinger Bands are a powerful technical analysis tool that measures market volatility. In the case of XLM/XRP, the current band configuration suggests a potential breakout. If historical trends hold, XLM could not only recover its recent losses but potentially surge past its previous highs.
For traders and investors, this represents a critical moment of opportunity. The tight compression of the Bollinger Bands often precedes substantial price movements, and the current XLM/XRP chart is displaying all the classic signs of an impending market squeeze.
Looking Ahead: A Crypto Pair to Watch
As the cryptocurrency market continues to evolve, the XRP and XLM pair remains one of the most intriguing to monitor. Their shared history, distinct use cases, and current market dynamics make them a fascinating study in cryptocurrency development and market behavior.
Investors and market enthusiasts would be wise to keep a close eye on how this relationship develops in the coming weeks and months. The potential for significant price movements remains high, and the XLM/XRP ratio could provide valuable insights into broader market trends.
 Saad Ullah


