 Saad Ullah
XRP is drawing attention again as price action tightens within a symmetrical triangle on the weekly chart. With trading volumes dropping and volatility shrinking, all eyes are on a potential breakout.
Technical Setup: Triangle Formation and Key Support
The chart shows XRP trading inside a narrowing triangle pattern, with the price hovering just above the 50-week moving average (MA 50), which is acting as strong support. XRP is currently near the $0.50 level, sitting right at the triangle’s upper trendline.
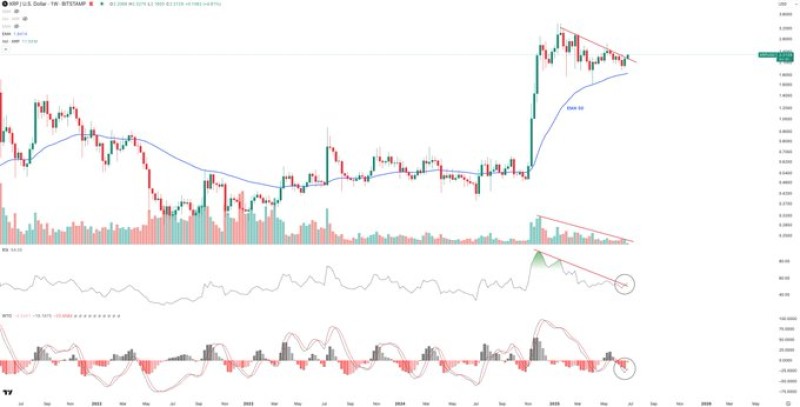
This reflects the market’s sentiment — a breakout may be near, but confirmation will require a spike in trading volume.
Momentum Indicators Suggest a Possible Shift
The RSI is showing a downward trend, but a slight uptick at the end could hint at bullish divergence. Meanwhile, the MACD is still in decline, though it looks like momentum is flattening and may be ready to flip upward soon.
Volume has been gradually decreasing — a classic pre-breakout signal — adding to the suspense.
Conclusion
XRP appears to be coiling for a move. If price breaks above the $0.50–$0.55 resistance with strong volume, it could trigger the next leg higher. For now, traders are waiting and watching closely, knowing that a major shift might just be around the corner.
 Saad Ullah


