 Usman Salis

Stellar shows dangerous warning signs after its massive rally, with heavy leverage and weak momentum pointing to a potential crash ahead.
Stellar (XLM) is trading around $0.47 after an incredible 103% monthly surge, but the party might be over. The rally has completely stalled, with daily candles now forming mostly indecisive Doji patterns that scream uncertainty. Two major red flags are flashing: a massive pile of leveraged longs sitting below current prices and momentum that's going nowhere fast. This setup looks eerily similar to what happened in December, and we all know how that ended.
XLM Price Sitting on a Leverage Time Bomb
Here's where things get scary for XLM holders. Bitget's liquidation data shows about $79.8 million in long positions versus just $42.1 million in shorts - that's almost double the bullish bets. The real problem? Most of these longs are clustered below $0.40, creating what traders call a liquidation cascade waiting to happen.
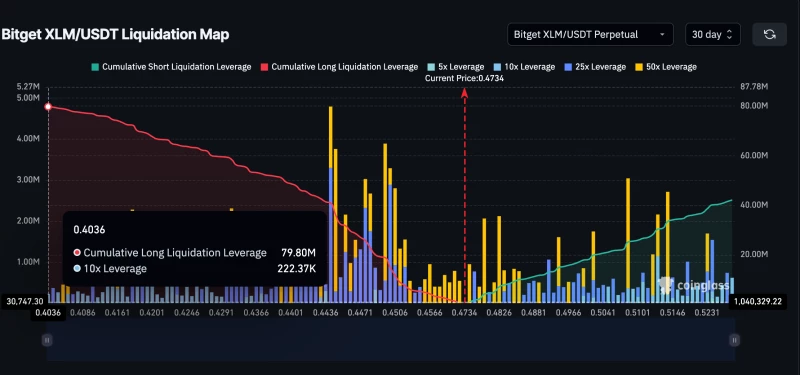
Think of it like dominoes. Once XLM starts dropping from its current $0.45+ levels, it'll trigger smaller liquidations first. But the real carnage begins under $0.40, where all those leveraged longs will get automatically closed out, flooding the market with sell orders. When you've got this much leverage stacked against you, even a small dip can turn into a bloodbath pretty quickly.
Stellar (XLM) Price Shows Same Pattern as December Crash
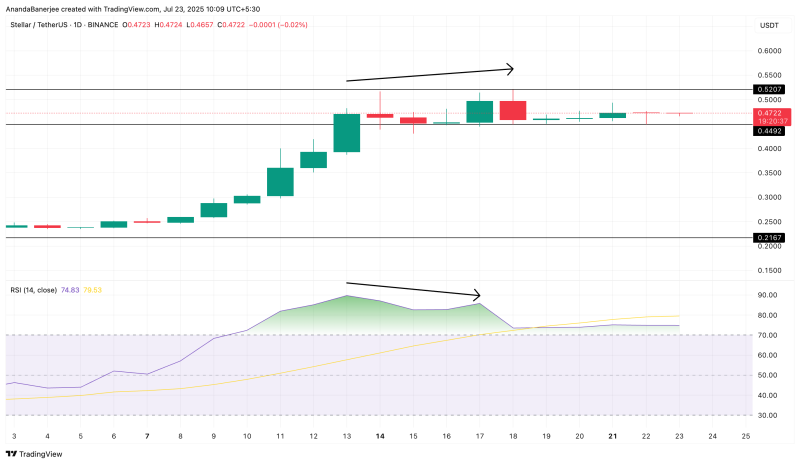
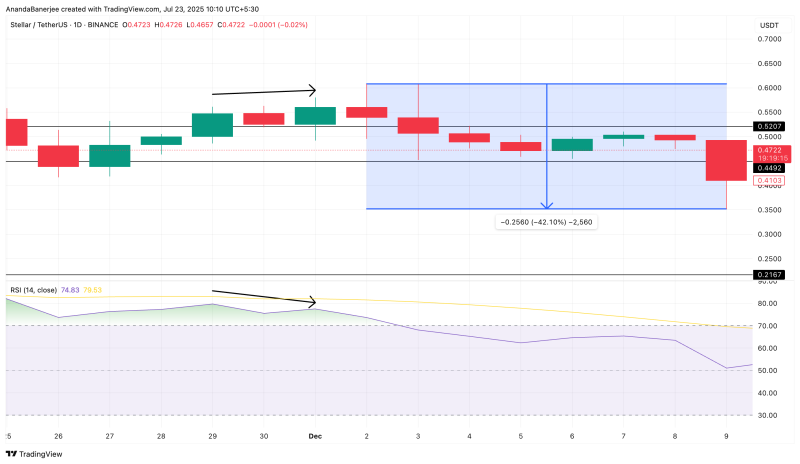
The technical picture isn't any prettier. Since July 14, XLM price has been hanging around its highs, but the RSI momentum indicator has been making lower peaks. This is called bearish divergence, and it's bad news. The last time we saw this exact pattern was in late December, right before XLM crashed over 40%.
RSI measures how strong recent price moves are on a 0-100 scale. When price stays up but RSI keeps dropping, it means the rally is running out of steam. Buyers are getting exhausted, and sellers are starting to circle. With all that leverage risk sitting below, this momentum weakness becomes a much bigger problem.
Key XLM Price Levels to Watch
So where could XLM fall to? Using Fibonacci retracements from the $0.21 low to the $0.52 high, the first major support is at $0.44. That's where the bulls need to make their stand. XLM is barely holding above this level right now.
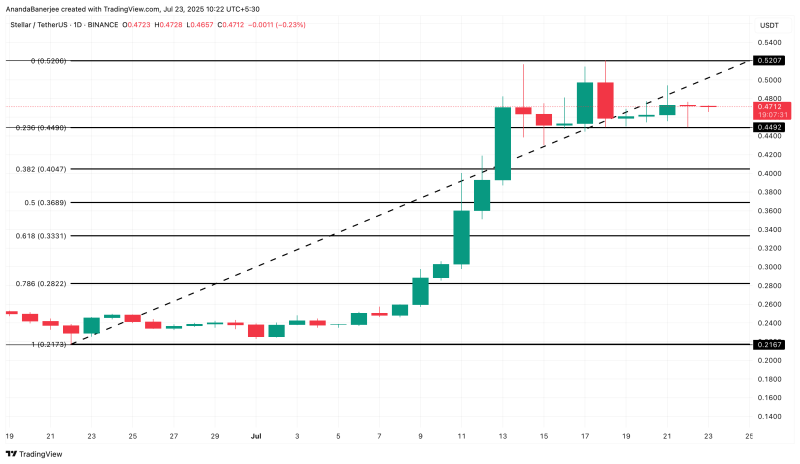
If $0.44 breaks on a daily close, then $0.40 becomes the next target - and that's where things could get ugly fast because of all those liquidations. Break $0.40, and we're looking at a possible drop to $0.33, which would be that 40% decline matching December's crash.
If somehow $0.33 fails to hold, then $0.28 is next, and at that point, the whole bullish structure falls apart.
The only way this bearish setup gets canceled? XLM needs to close back above $0.52 with RSI turning up and those liquidation risks cooling off. Until then, the bears are in control.
Want more token insights like this? Sign up for Editor Harsh Notariya's Daily Crypto Newsletter here.
 Usman Salis


