 Usman Salis

Ethereum has reached a pretty significant spot at $2,590, and it's not just any random level. This price point lines up with several technical factors that make it a real headache for bulls trying to push higher. We're looking at the 0.618 Fibonacci retracement level meeting the midpoint of ETH's current price channel - that's a lot of resistance packed into one area.
The thing about $2,590 is that it's been a stubborn level historically. It's where the Fibonacci retracement from the previous high down to that $1,920 swing low sits, and these mathematical levels often act like invisible walls in the market. Plus, this level marks the middle of the broader Fibonacci channel that's been guiding ETH's moves lately.
When you get this many technical factors pointing to the same price level, traders pay attention. It's what we call a confluence zone, and it often means the market might take a breather or even reverse temporarily.
Ethereum (ETH) Harmonic Pattern Points to Strategic Pullback
Here's where things get interesting. Technical analysts are spotting a potential Butterfly harmonic pattern forming on ETH's chart. If you're not familiar with these patterns, they're basically a way to predict where the market might go next based on specific price relationships.
For this pattern to play out correctly, Ethereum would need to pull back to around $2,226 first. That's not random either - it's where strong support levels converge, making it a likely spot for buyers to step in. Think of it as ETH taking a step back to take two steps forward.
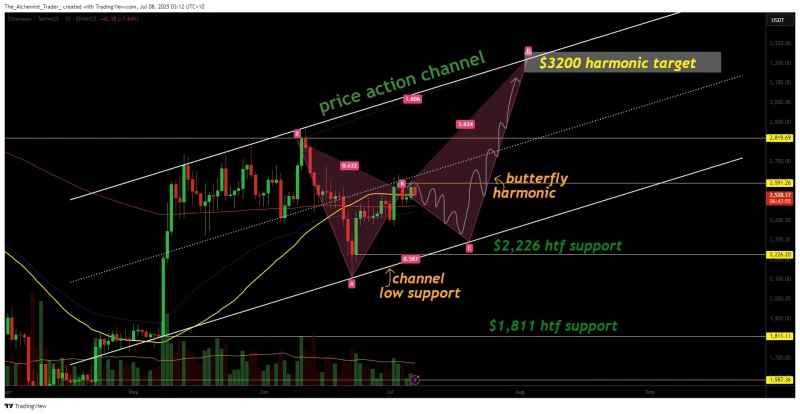
If the pattern completes as expected, we could see ETH make a run toward $3,200. That target sits right at the upper boundary of the price channel and represents a major resistance zone that could be the next big challenge for Ethereum bulls.
ETH Price Action: Volume Tells the Story
Right now, ETH's volume isn't exactly screaming "breakout mode." The trading activity has been pretty quiet, which is actually important because real breakouts usually need heavy volume to stick. Without that surge in buying interest, any move above $2,590 might just be a fake-out.
This is where the pullback scenario makes sense. A healthy retracement to $2,226 would complete the harmonic pattern and potentially set up a much stronger foundation for the next leg up. It's like building momentum for a bigger jump.
The key things to watch are simple: if ETH breaks above $2,590 with strong volume, the pullback idea goes out the window and we might see an accelerated move higher. But if it gets rejected here, that $2,226 level becomes the next major target.
For traders, this setup offers pretty clear levels to work with. A pullback wouldn't be a sign of weakness - it might actually be exactly what ETH needs to set up for that $3,200 target. The harmonic pattern framework suggests this kind of back-and-forth movement is normal and healthy before bigger moves unfold.
 Usman Salis


