 Saad Ullah
Cardano cryptocurrency faces a potential bearish technical pattern as the eighth-largest digital asset by market cap shows signs of a moving average crossover on its four-hour chart.
Cardano (ADA) Technical Indicators Signal Potential Bearish Pattern
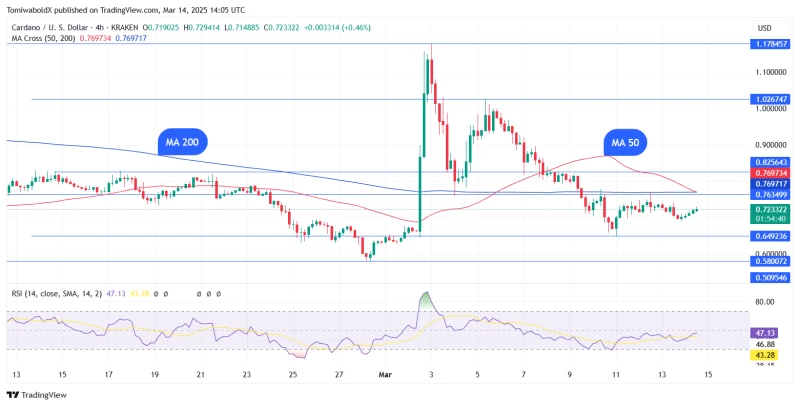
Cardano (ADA), currently ranked as the eighth-largest cryptocurrency by market capitalization, is approaching a critical technical juncture on its four-hour chart. The four-hour simple moving average 50 (SMA 50) and the simple moving average 200 (SMA 200) have converged and appear poised to cross over in the coming hours. With the SMA 50 trending downward—reflecting recent bearish market sentiment—the likelihood of a death cross formation has significantly increased.
A death cross occurs when the shorter-term 50-period simple moving average crosses below the longer-term 200-period simple moving average, typically signaling the potential onset of a downtrend. Should the SMA 50 dip below the SMA 200 in the next trading sessions, this bearish technical pattern would be confirmed. Conversely, a reversal of this pattern would create what traders call a golden cross, which generally indicates bullish momentum.
Cardano (ADA) Bulls Show Resilience at Key Support Levels
Despite the looming bearish crossover, Cardano supporters aren't surrendering without resistance. Notable buying pressure has emerged around critical support zones, suggesting that bullish traders are actively working to prevent further price deterioration and potentially trigger a market rebound. At press time, Cardano was trading at $0.7217, down 1.19% over the previous 24 hours.
The cryptocurrency showed promising signs early Friday when it rebounded from the MA 200 at $0.694, indicating that bulls are attempting to halt the recent decline. This bounce from a significant technical level provides some hope for ADA holders looking for signs of recovery in the short term.
Cardano (ADA) Price Action: Critical Levels to Watch
Bears appear determined to maintain downward pressure, with selling expected near the moving averages. If the ADA price falls below the daily SMA 50 at $0.798, it would signal continued selling on rallies. Under this scenario, bears might attempt to strengthen their position by pushing the price below the $0.69 support level, potentially triggering a decline to $0.60, with further weakness possibly extending to the $0.50 region.
However, the situation isn't entirely bleak for ADA supporters. A break and close above the daily SMA 50 could indicate a bullish resurgence, potentially propelling ADA toward the $1.02 price target. This level would represent a significant recovery and could shift market sentiment back in favor of the bulls.
As market participants closely monitor the potential death cross formation, Cardano bulls are focusing their efforts on holding key support zones while pushing for a reversal in price action. The trading sessions ahead will be crucial in determining whether ADA can avoid the bearish technical pattern and reclaim its upward momentum.
The convergence of these moving averages comes at a particularly sensitive time for the cryptocurrency market as a whole, with many digital assets experiencing increased volatility. For Cardano specifically, maintaining support above the $0.69 level appears critical to preventing a more substantial decline in the short term.
Technical analysts suggest that volume patterns in the coming days could provide additional insights into the strength of any potential moves, whether continuing downward or reversing to the upside. Increased trading volume accompanying a price recovery would lend credibility to any bullish reversal, while high-volume selling could accelerate the downside if support levels fail to hold.
As the eighth-largest cryptocurrency by market capitalization, Cardano's price movements carry significance beyond just ADA traders, potentially influencing sentiment across the broader alternative cryptocurrency market. The resolution of this technical pattern could therefore have implications extending beyond just Cardano's immediate price action.
 Saad Ullah


