 Victoria Bazir

Cardano (ADA) price is coiling up before what could be a solid rebound. The latest analysis suggests ADA may dip one more time toward support before climbing back toward $1. The TradingView chart shows ADA moving sideways after a sharp drop, with buyers potentially waiting to step in near the lower range. If this plays out, we could see a stronger recovery phase as 2025 winds down.
ADA Technical Overview: Support and Resistance Levels
According to trader FOUR | Crypto Spaces, two zones matter most right now. The support zone sits around $0.55–$0.60, marked in green on the chart. This area has caught buyers' attention repeatedly since July—every dip into this range sparked a bounce, making it a reliable accumulation zone. The resistance zone hovers near $1.00, shown in red.
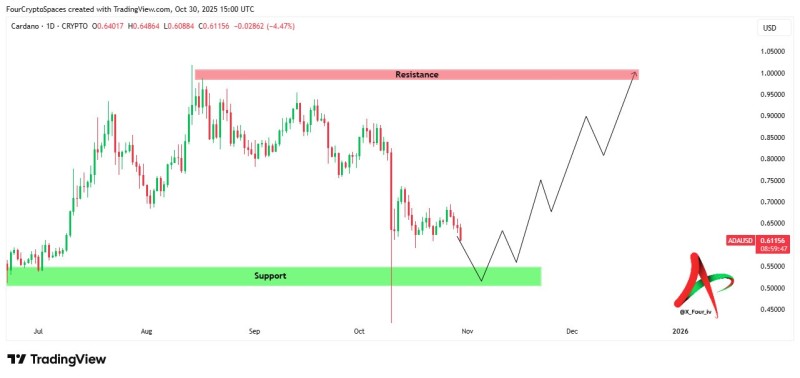
This level acts as both a psychological barrier and the ceiling of ADA's recent trading range. Each time price approached this area, sellers showed up and pushed it back down. The projected path shows a quick pullback toward support, then a series of higher lows leading up toward $1 by late Q4 2025.
Technical Context: A "Final Dip" Before Recovery
The forecasted move suggests ADA will test support before reversing higher. The decline looks corrective rather than a full trend breakdown, meaning the market is likely consolidating instead of completely flipping bearish. Once the correction bottoms out near $0.55, a recovery pattern could take shape, setting up a run toward $0.80 and then $1.00. This behavior mirrors classic reaccumulation phases before bullish reversals—price dips into support, liquidity resets, and momentum kicks back in.
Broader Market Context
Cardano's setup doesn't exist in a vacuum. As Bitcoin holds steady above key levels, money tends to flow into major altcoins like ADA. On-chain activity shows development in Cardano's DeFi and staking ecosystem continues at a healthy pace, backing the long-term story. Investor sentiment, despite the short-term chop, shows accumulation patterns among holders who believe in ADA's current value zone. If these factors stick around, ADA's chart could follow earlier patterns where quiet consolidation gave way to multi-week rallies.
Path Toward the $1 Level
If ADA holds above $0.55, a move toward $0.80–$1.00 becomes the likely scenario. Breaking cleanly above $1 would confirm a trend shift and potentially kick off a broader bullish cycle. On the flip side, losing the support range could stall the recovery and drag ADA toward $0.50 before buyers return. For now, the structure favors the "dip then climb" scenario outlined in the analysis.
 Victoria Bazir


