Usman Salis
Sometimes the best way to see what's really happening in a stock is to flip everything upside down. That's exactly what traders are doing with Nvidia right now, and what they're seeing has everyone talking. An inverted chart analysis is revealing some interesting patterns that could signal whether NVDA is ready to bounce back or if there's more pain ahead.
NVDA Price and the Inverted Chart Setup
Nvidia has grabbed traders' attention with an unusual chart perspective that's highlighting a potential turnaround story. According to analysis from @TrendSpider, when you flip NVDA's daily chart upside down, you can see what looks like a rounded bottom pattern forming.
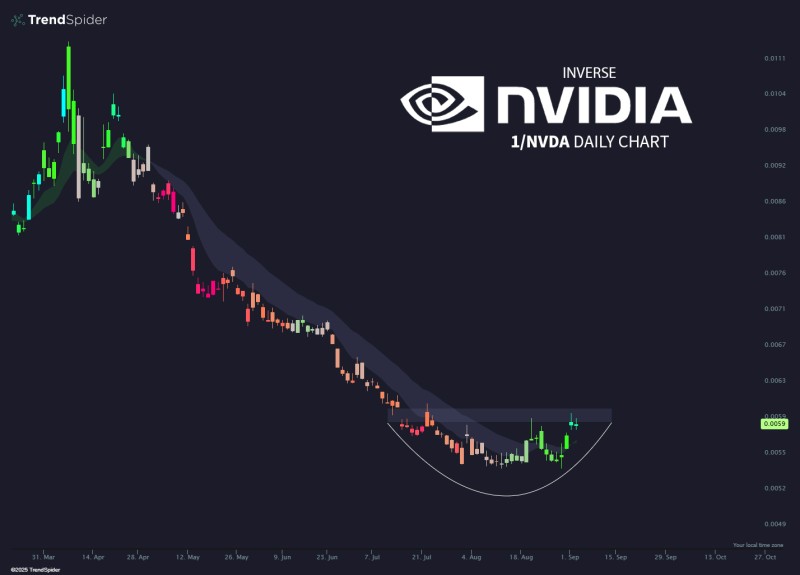
The stock is currently testing a key level around 0.0059, and this could be the make-or-break moment that determines where NVDA heads next. It's one of those technical setups that either works beautifully or fails spectacularly.
Looking at the inverted chart, you can see a gradual curve developing after months of decline – the kind of pattern that often marks the start of a recovery. The 0.0059 level is the line in the sand right now.
If NVDA can push above this resistance, we could see a move toward 0.0065–0.0070. But if it gets rejected here, the stock might slide back to the 0.0052 support area.
The key thing to watch is volume. Without solid buying interest backing up this pattern, the whole setup could fall apart.
Market Sentiment on NVDA Price
Traders are split on what happens next. Some see this inverted setup as the start of a new bullish run, while others think external factors and company fundamentals need to line up for any breakout to stick.
One thing everyone agrees on though: this is a critical moment for the bulls. As one trader put it, "bulls can't flinch here" – and that pretty much sums up where we stand with NVDA right now.
 Usman Salis