 Saad Ullah

SEI has stabilized above $0.31 after recent weakness. Technical analysis shows promising recovery signs, with key momentum indicators aligning at a potential local bottom. Multiple bullish signals suggest possible upward movement toward resistance levels.
SEI Shows Signs of Recovery
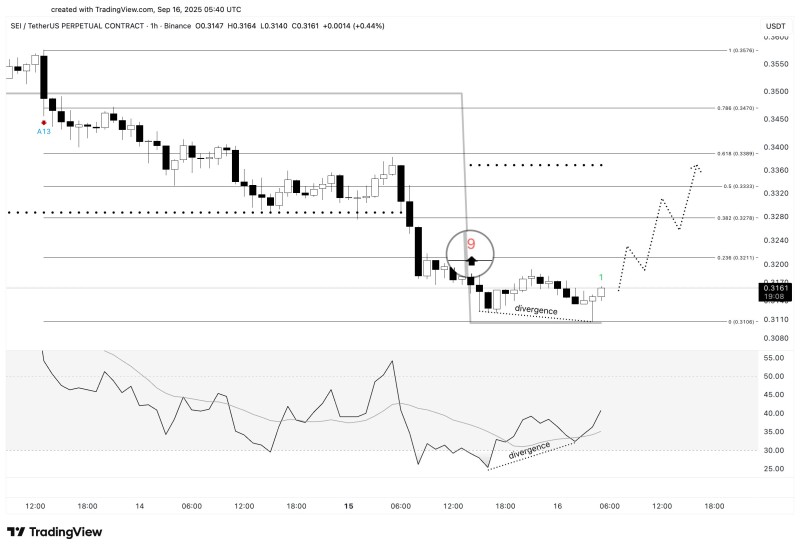
SEI has stabilized following its decline, finding support above $0.31. The hourly chart displays a TD Sequential "9" formation alongside bullish divergence, indicating a potential shift in sentiment. Analyst Ali noted this technical confluence, pointing to SEI's positioning for a possible move toward higher resistance areas.
These signals often mark the end of short-term selling pressure and renewed buying interest.
Technical Setup Points to Higher Prices
The current technical picture reveals encouraging developments. A TD Sequential "9" has printed at the recent low around $0.311-0.313, typically signaling downside exhaustion. Meanwhile, RSI divergence shows higher lows even as price retested support, suggesting underlying strength. Fibonacci retracement levels provide upside targets: $0.321 (23.6%), $0.328 (38.2%), $0.333 (50%), $0.339 (61.8%), and $0.347 (78.6%). The primary target sits around $0.34. However, a break below $0.311 would invalidate this scenario.
The TD "9" signal historically marks turning points in short-term trends, while RSI divergence indicates buyers may be stepping in. The broader crypto market's positive tone could provide additional support for SEI's recovery.
Critical support remains at $0.311-0.313, with $0.321 as the initial breakout level. Short-term targets include $0.328 and $0.333, while the main objective lies at $0.339-0.340.
SEI presents an interesting technical setup with indicators suggesting a possible rebound from current levels. The TD Sequential "9" and RSI divergence at local lows create a foundation for upward movement toward $0.34. Success depends on maintaining support above $0.311 while breaking through $0.321 to confirm the bullish scenario.
 Saad Ullah


