Usman Salis

Ethereum (ETH) has been hovering around the $4,600 level, but technical signals are pointing to a possible short-term correction. The TD Sequential, a widely-used indicator for spotting market exhaustion, has triggered a sell signal that could send ETH lower. Trader Ali highlights that a dip toward $4,570 might occur before bulls regain control.
Technical Setup Points to Weakness
The ETH/USDT 10-minute chart reveals several key technical levels:
- A TD Sequential "9" previously marked a local bottom and sparked recovery
- A fresh "1" sell setup has now emerged, indicating weakening momentum near $4,600
- Fibonacci retracements highlight support zones at $4,594 (0.786 Fib), $4,585 (0.618 Fib), and $4,570 (0.5 Fib)
Famous trader Ali highlights that a dip toward $4,570 might occur before bulls regain control.
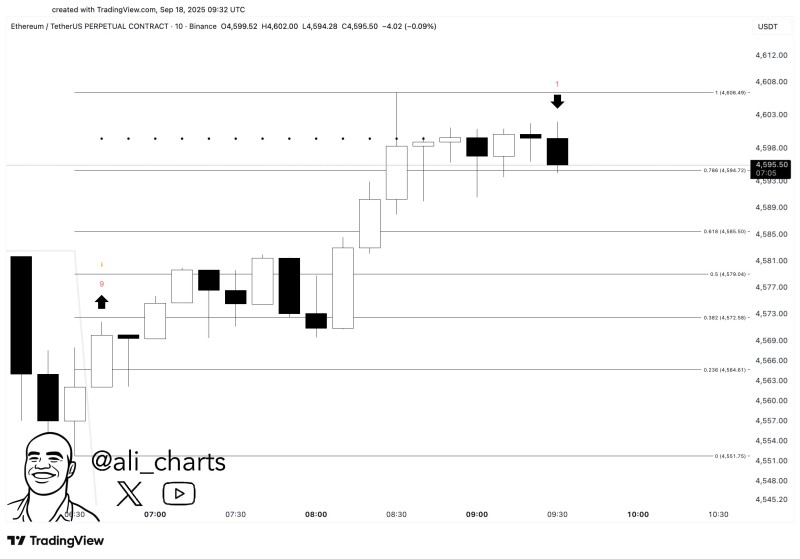
Current resistance sits at $4,606, which represents the recent intraday high. Breaking above this level could shift sentiment back to bullish. On the downside, support comes in layers at $4,594, then $4,585, and finally $4,570. Holding above these zones remains crucial for maintaining the broader uptrend.
Why the Pullback Makes Sense
The TD Sequential has proven reliable historically when identifying local tops and bottoms. Additionally, Ethereum has struggled twice to break convincingly above $4,600, demonstrating that sellers are stepping in at this level. While the longer-term structure remains bullish, short-term momentum appears to be cooling off.
What's Next for ETH
Two scenarios are playing out for Ethereum's next move. In the bearish case, ETH could retreat to the $4,570 support zone before finding stability. However, if bulls can push price above $4,606 resistance, it could trigger a rally toward $4,650-$4,700.
 Usman Salis