 Saad Ullah

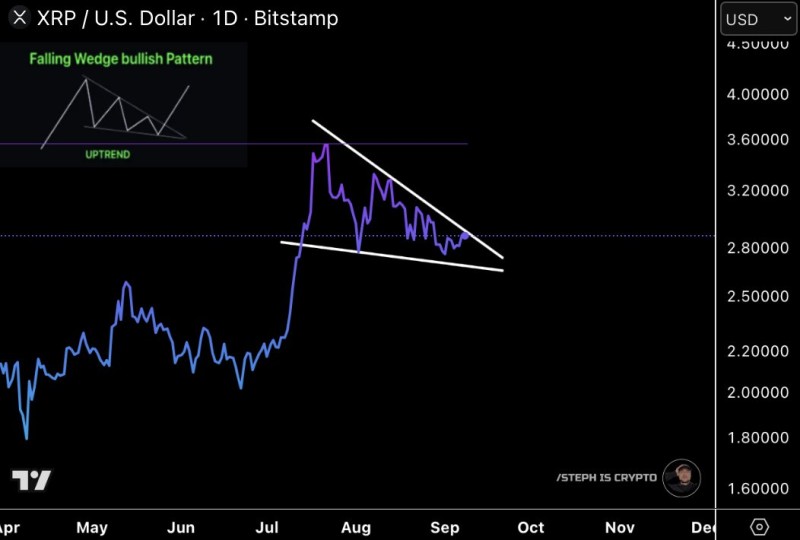
XRP (Ripple) is approaching a critical juncture as it compresses within a falling wedge formation on the daily chart. This classic bullish pattern suggests the cryptocurrency could be gearing up for a significant breakout, with momentum building near the $2.80 zone. Traders are watching closely as price action tightens, setting the stage for volatility expansion.
Technical Pattern Analysis
The daily chart shows a well-defined falling wedge with descending highs and converging support near $2.60–$2.70. This consolidation follows a sharp summer rally, making the pattern particularly notable. Falling wedges typically resolve bullishly once buyers reclaim the descending trendline.
Famous trader @Steph_iscrypto highlights, a huge breakout could be incoming if XRP clears wedge resistance.
The pattern structure confirms reliability after multiple touches of both boundaries.
Market Analysis and Price Targets
A decisive close above $2.90–$3.00 would mark a breakout, potentially attracting strong momentum. First resistance sits around $3.20, followed by $3.60, with a measured move projecting as high as $4.00–$4.10 if sustained.
Holding above $2.70 remains crucial, with stronger support near $2.50–$2.60. A breakdown below this invalidates the bullish setup. The prolonged compression often results in sharp breakouts, while current altcoin rotation may favor large-cap tokens like XRP.
In the bullish scenario, breaking $3.00 opens paths toward $3.20–$3.60, with $4.00 as extended target. The neutral case involves sideways trading between $2.70–$2.95 until decisive movement. The bearish scenario sees closes below $2.60–$2.70 risking drops toward $2.50 or lower.
XRP's structure favors bullish breakout if wedge resistance breaks. Traders should watch for closes above $2.90–$3.00 as confirmation. If the bullish scenario unfolds, XRP could move significantly toward $3.60 and beyond.
 Saad Ullah


