 Peter Smith

Stellar has been catching the attention of technical analysts lately, and for good reason. The cryptocurrency is setting up what looks like a classic bullish flag pattern, the kind of formation that often leads to explosive moves higher. With XLM trading in a tight consolidation range, traders are watching closely to see if this setup will deliver the breakout that could send the price toward some impressive targets.
XLM Price Action Shows Bullish Flag Formation
Right now, Stellar is playing it cool, trading within a neat bullish flag pattern on the 2-day chart. This is exactly the kind of setup that gets traders excited because it usually means the previous uptrend is just taking a breather before continuing higher. The price is finding solid support around $0.33–$0.35, while the key resistance level to watch sits above $0.45.
Crypto analyst @bitamberly has been keeping an eye on XLM's price action and likes what they're seeing. The ongoing consolidation is basically squeezing out the sellers and putting more power in the hands of the buyers. According to their analysis, once Stellar breaks free from this flag pattern, it could move pretty quickly to test higher levels.
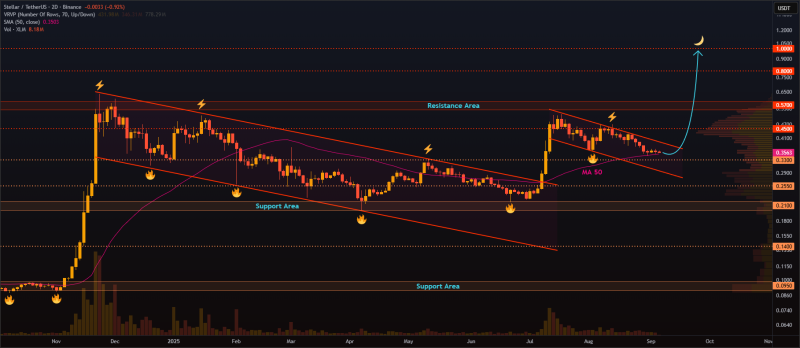
The roadmap looks something like this: first stop at $0.45, then $0.57 for the near term. But if the momentum really kicks in, we could see XLM push toward $0.80 and maybe even that sweet psychological level at $1.00.
XLM Price Outlook: Can Stellar Reach $1?
If Stellar manages to break above that resistance zone, it would basically confirm that this bullish pattern is the real deal, potentially sending prices much higher. Getting past $0.57 would likely bring in more momentum traders, which could fuel a rally toward $0.80 and possibly even $1.00.
But here's the thing to watch out for: if the support around $0.33 doesn't hold, this whole bullish setup could fall apart, and we might see XLM test lower levels instead. That's just how these patterns work – they either deliver big moves up, or they break down and disappoint.
 Peter Smith


