Saad Ullah

Solana (SOL) shows a classic rally-pullback pattern. The coin recovered sharply from its August low at $155, broke key resistance levels, and peaked near $209. After rejection, SOL pulled back but holds around $202 — now the key battleground for traders. Whether buyers defend this area will decide the next move.
Market Position: $202 Testing Ground
Solana's chart shows a clear uptrend structure. Trader @anastamaverick notes that the $155 bottom triggered a strong reversal, with breakouts above $177 and $185 confirming bullish momentum.
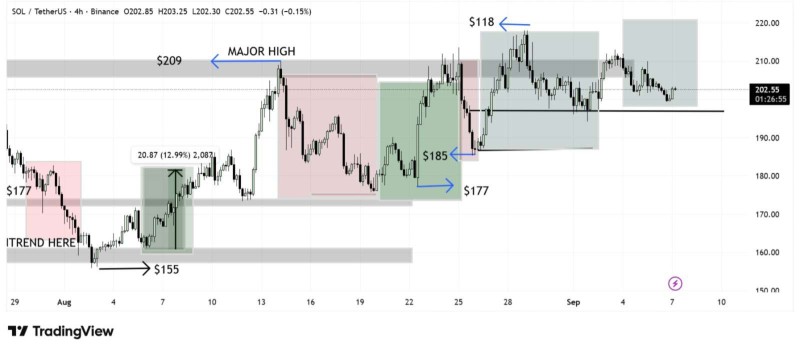
Price reached $209 before meeting selling pressure and retracing to $202, which now provides support. This level serves as the pivot point — a bounce could reignite momentum, while a breakdown risks a slide to $185-$177.
Technical Analysis and Price Targets
The chart displays Solana's typical impulse-consolidation cycles where sharp rallies follow pullbacks. Key levels include immediate support at $202, secondary support at $185-$177, major resistance at $209, and next target at $218. The bullish structure remains intact with higher lows at $155, $177, and $185. Holding above $200 reinforces trader confidence, while sideways action around $202 may compress volatility before the next significant move.
If $202 holds, SOL could quickly retest $209 with potential extension toward $218-$230. Failure to reclaim $209 may result in range-bound trading between $185-$209. A break below $202 would expose $185-$177 support, with deeper downside risk toward $155 if this area fails.
 Saad Ullah