Saad Ullah

PEPE coin is showing fresh momentum on the 15-minute chart as bulls keep price action near the top of its daily range. With support holding and repeated pushes toward resistance, traders are watching for a potential move above $0.00000978.
PEPE Price Analysis (15-Minute Chart)
Analyst @anastamaverick reports PEPE/USDT trades around $0.00000977, up +1.03%. The 15-minute chart shows steady climbing with green candles dominating, positioning just below the 24-hour high.
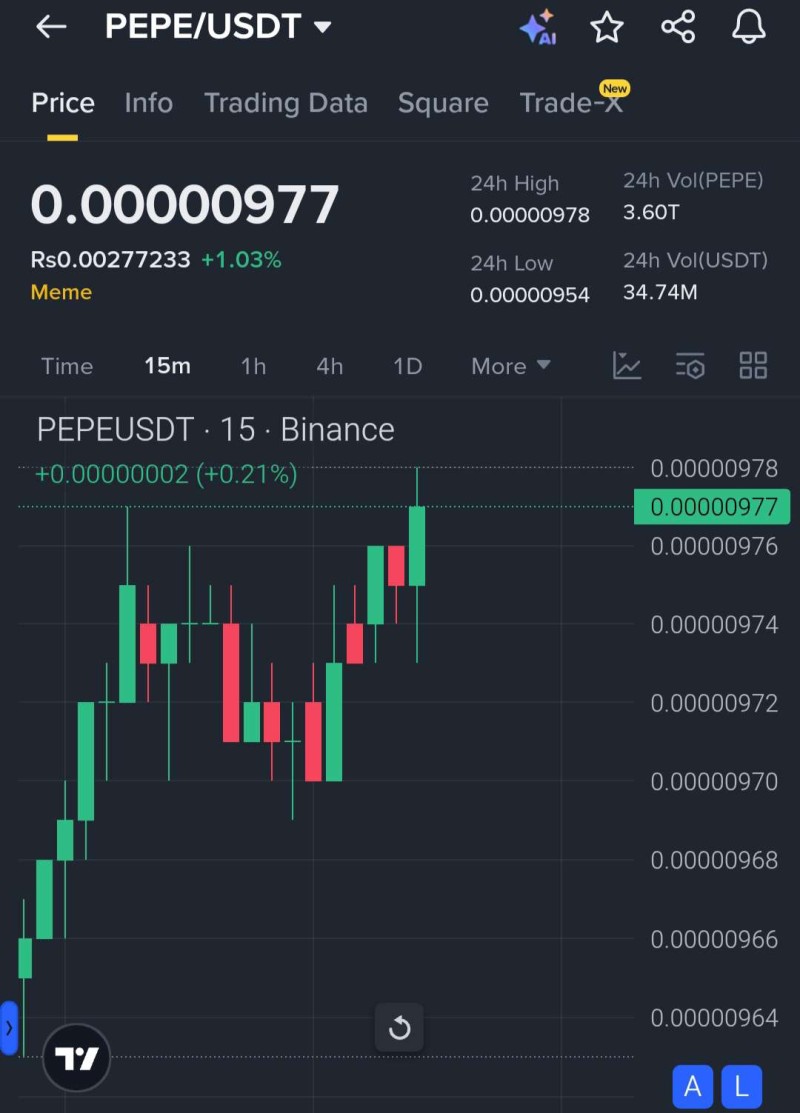
This momentum suggests bulls are preparing for another test of resistance.
Key Trading Metrics:
- 24h High: $0.00000978
- 24h Low: $0.00000954
- 24h Volume: 3.60T PEPE (~34.74M USDT)
Buyers are stepping in around $0.00000970–$0.00000972, creating strong local support. This defense suggests solid short-term demand.
Immediate resistance sits at $0.00000978. A break above targets $0.00000990 and $0.00001000. Support holds between $0.00000970–$0.00000972, while major support remains at $0.00000954. Breaking below this level would shift momentum to bears. The candlestick pattern shows range compression near highs with higher lows indicating accumulation pressure.
PEPE Price Prediction
A breakout above $0.00000978 could push PEPE to $0.00000990–$0.00001000, with potential for $0.00001010–$0.00001020 if momentum builds. Failure to clear resistance keeps PEPE in $0.00000970–$0.00000978 range. A breakdown below $0.00000970 would target $0.00000960 and $0.00000954, invalidating the bullish structure.
 Saad Ullah