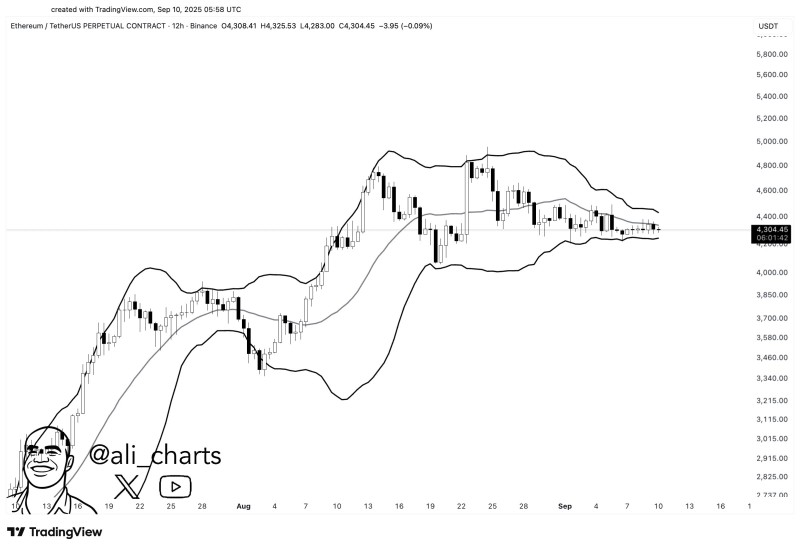
Ethereum's been stuck in neutral around $4,304, but that's about to change. The Bollinger Bands are squeezing tighter by the day, and anyone who's watched crypto long enough knows what comes next - volatility.
Current Technical Picture
According to analyst Ali, this exact setup has triggered some of ETH's biggest moves in the past. The only question now is which direction it breaks. The 12-hour chart tells the whole story. ETH's trading range keeps getting smaller after that run above $4,800 fizzled out. Here's what matters right now:

- Current level: $4,304 acting as the pivot point
- Key support: $4,200-$4,250 zone has held up through multiple tests
- Major resistance: $4,600-$4,800 where bulls got rejected before
- Bollinger squeeze: Bands are as tight as they've been in weeks
- Volume: Drying up as traders wait for the next big move
The mid-band is acting like a magnet, keeping price action contained. But compressed bands don't stay compressed forever - they explode outward when the pressure builds up enough.
Technical setups like this are why volatility has dropped to multi-week lows. It's like a spring getting wound tighter and tighter. Market sentiment around Ethereum stays bullish thanks to network growth and institutional buying, plus Bitcoin's strength usually helps ETH break higher. On-chain data shows whales accumulating around these levels, which adds fuel to the bullish case.
What Happens Next
This squeeze won't last much longer. A clean break above $4,600 opens the door to $5,000 and beyond - that's where the real FOMO kicks in. But if $4,200 fails to hold, we're probably looking at a trip back to test $3,800 support. Either way, the next few days should give us our answer about where Ethereum heads for the rest of the year.
 Saad Ullah

 Saad Ullah


