Peter Smith

Dogecoin (DOGE) is drawing attention from technical traders once again as a well-defined contracting triangle has formed on the lower time frame chart. According to a recent post by popular X user and chart analyst Trader Tardigrade, this setup could offer a “super great entry” for bullish momentum — if the pattern plays out as expected.
DOGE Price Coils into Contracting Triangle
Dogecoin (DOGE) is currently consolidating within a contracting triangle on the 5-minute chart (M5). The wave structure is labeled a-b-c-d-e, and DOGE is approaching the final leg (e), near a key support zone around $0.1630–$0.1635.
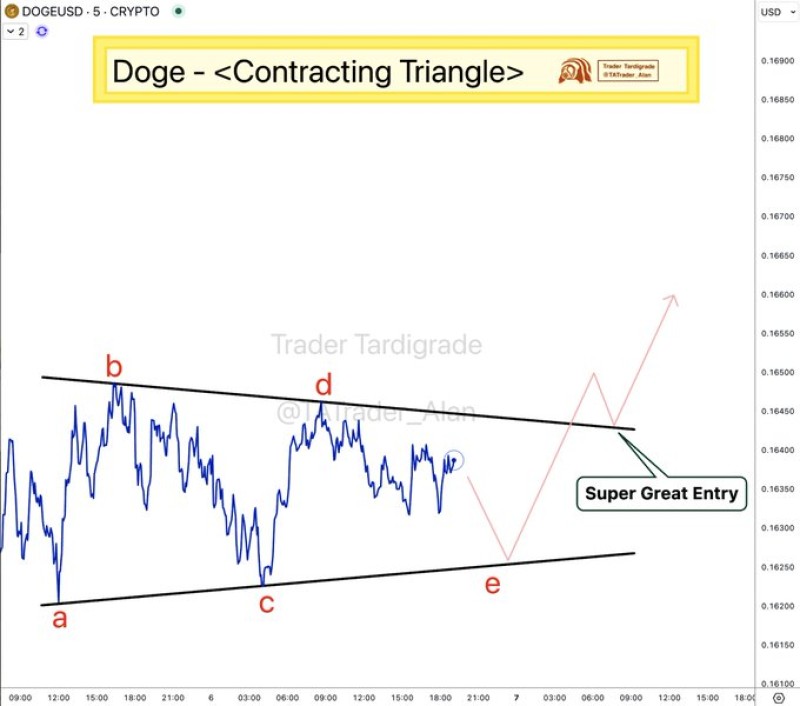
This level is marked on the chart as a “super great entry,” suggesting that traders could be looking to position long just before a potential breakout. The chart’s range spans between approximately $0.1610 and $0.1680, with tightening price action indicating growing pressure for a breakout.
Breakout Potential Toward $0.165 and Higher
The upper resistance of the triangle sits just below $0.165, and a clean breakout above this threshold could trigger a quick move toward higher intraday levels. While the short-term chart offers only limited historical data, contracting triangles are often reliable continuation patterns — especially in trending markets.
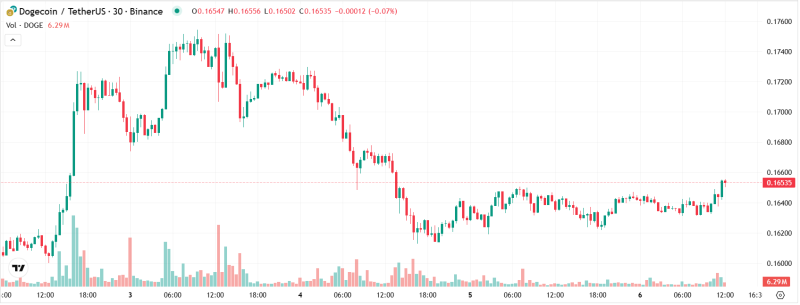
DOGE is currently trading near $0.164, and any decisive breakout above $0.165 could target levels at $0.1665 and beyond, as indicated by the projected arrows on the chart.
 Peter Smith