Usman Salis

Gold (XAU) impressive bullish momentum has been the standout story in recent trading sessions, with prices surging from the $3,380 region to fresh highs near $3,600. However, beneath this strong surface performance, warning signs are beginning to emerge. Technical indicators are starting to diverge from the price action, suggesting that buying pressure may be waning. The critical question now facing traders is whether the $3,552 support level will hold or if we're about to witness a meaningful pullback in the precious metal.
Technical Momentum Shows Signs of Weakness
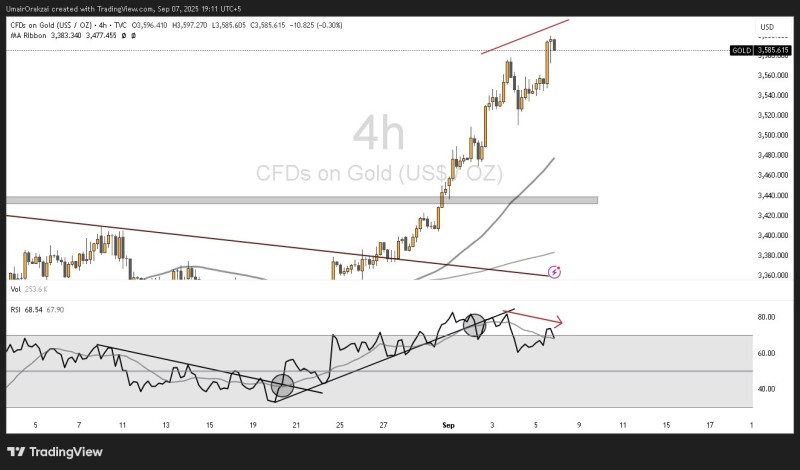
Gold rally on the 4-hour timeframe has been nothing short of impressive, with prices climbing to peak levels around $3,597–$3,600. Yet despite these higher highs, the Relative Strength Index has begun to paint a different picture entirely. The RSI has rolled over significantly, breaking its established uptrend line and creating a classic bearish divergence pattern against the underlying price action.
This divergence pattern, as highlighted by @Umairorkz, represents a textbook warning signal where price continues to make new highs while the underlying momentum fails to confirm these moves. It's often one of the first signs that a trend may be losing steam.
The appearance of the latest red candle on the chart only adds further weight to concerns about a potential short-term reversal in gold's fortunes.
Key Scenarios and Trading Levels
The technical divergence serves as the primary warning signal, while profit-taking after such a rapid rally adds further downward pressure. From a macro perspective, stronger U.S. yields or dollar strength typically creates headwinds for gold.
A confirmed close below $3,552 support would validate the bearish divergence and target the $3,500–$3,480 zone, which aligns with key moving averages. Range-bound trading between $3,552–$3,600 remains possible as bulls and bears compete for control. However, a decisive break above $3,600 would invalidate current bearish signals and open the path toward $3,650–$3,700.
The immediate resistance sits at $3,597–$3,600, while $3,552 remains the critical support level that could trigger the anticipated corrective move.
 Usman Salis