Saad Ullah
Crypto analyst @ali_charts recently dropped a chart that's got ADA holders buzzing. The comparison shows Cardano's current price action looking remarkably similar to its explosive 2020-2021 run that took the token beyond $3. With Fibonacci levels lining up almost perfectly, we might be seeing history about to repeat itself.
ADA's Fibonacci Setup Points to Breakout Territory
The side-by-side analysis reveals some pretty compelling patterns. Back in the day, Cardano rocketed from around $0.15 to over $3 after smashing through the 0.5 Fibonacci level. Right now, ADA is sitting at $0.765, with that crucial 0.5 level hovering near $0.853 — basically the same setup we saw before.
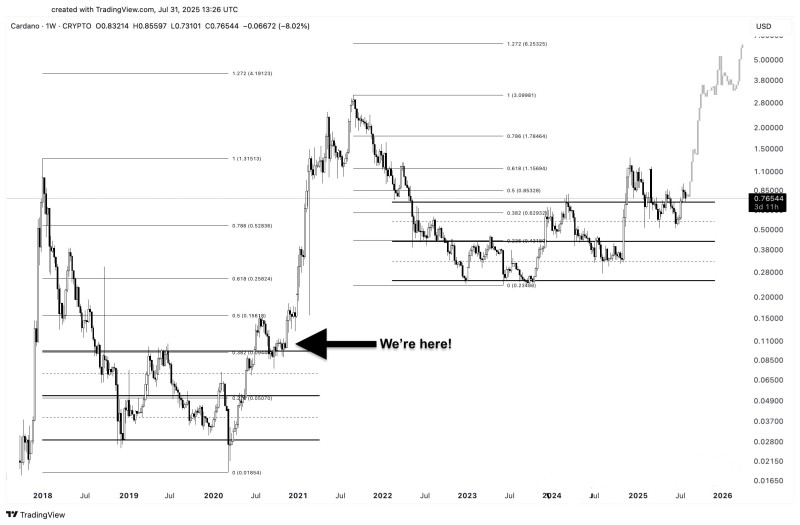
The analyst's pointing to where we are now, saying "We're here!" and marking it as nearly identical to early 2021. If ADA can push past $1.15 (0.618) and $1.78 (0.786) in the coming weeks, we could be looking at the start of another major bull run.
Slower This Time, But Potentially Stronger
What's interesting is that this cycle seems to be playing out more gradually than the last one. While that might test some traders' patience, it could actually be setting up for a more solid, sustainable rally. The long-term Fibonacci targets are pretty wild — we're talking $3.09, $4.19, and even $6.25 if this pattern holds up.
Bottom Line
Cardano (ADA) appears to be following one of its most successful historical patterns. With key support levels holding and technicals aligning with past cycles, traders are keeping a close eye on whether ADA can break out toward $3 and potentially much higher. If the pattern holds, ADA could be gearing up for one hell of a ride.
 Saad Ullah