 Peter Smith

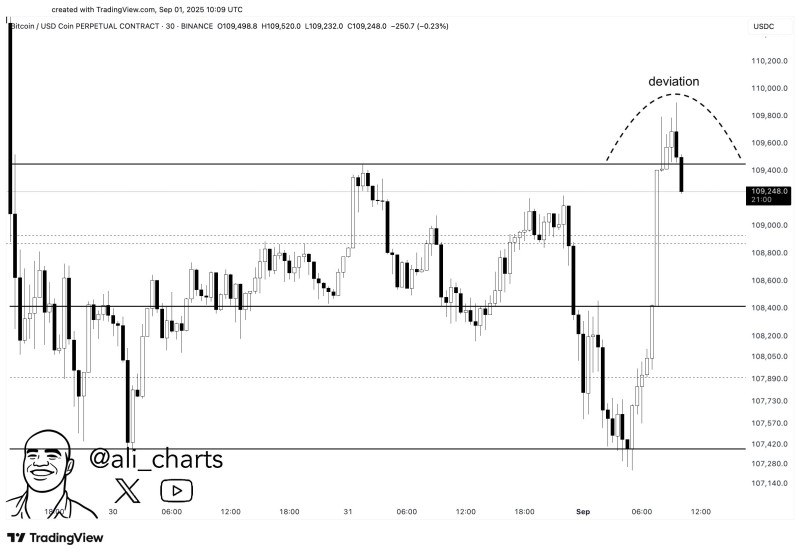
Bitcoin's recent price action has caught traders' attention as the cryptocurrency briefly touched $109,800 before quickly retreating to $109,200. This movement has created what technical analysts call a deviation pattern - a setup that often precedes significant price movements in either direction.
BTC Price Shows Deviation Signal
Bitcoin tried to push higher toward $109,800 but couldn't hold the gains, dropping back to $109,200. This kind of false breakout is called a deviation - when price briefly escapes its normal range but quickly snaps back, often leaving breakout traders stuck in losing positions.
Market analyst @ali_charts noted that these deviation patterns often come before strong price reversals. Since Bitcoin couldn't stay above $109,600, bulls should be cautious as this could lead to further drops if the current support doesn't hold.
Key BTC Levels to Watch
Resistance levels:
- $109,600 - $110,000: Bulls need to reclaim this zone
Support levels:
- $109,200: Current short-term support
- $108,400 and $107,400: Next support zones if selling continues
If Bitcoin breaks back above $109,600, it could test $110K again. But if $109,200 fails, the price might drop to the mid-$108K range.
Bitcoin Price Outlook
This deviation pattern shows the market is undecided about Bitcoin's next move. While the overall trend is still positive, short-term volatility is picking up. Traders are waiting for a clear signal - either a solid break above $110K or a rejection that sends price down to $108K-$107K.
With economic events and market liquidity changes adding pressure, Bitcoin's ability to hold above $109K will likely determine where it heads in September.
 Peter Smith


