 Usman Salis
Nvidia's stock just flashed a signal that hasn't appeared in months, and traders are buzzing. With earnings just around the corner and technical indicators aligning, NVDA might be setting up for its next big move.
NVDA Tests Critical Bollinger Band Support Level
Nvidia's stock has just touched the lower Bollinger Band at $171.24 – something we haven't seen since April's selloff. This rare technical event has caught traders' attention, as NVDA historically bounces hard from these extreme levels.
The current Bollinger Band setup shows:
- Upper Band: $185.45
- Middle Band: $178.48
- Lower Band: $171.52
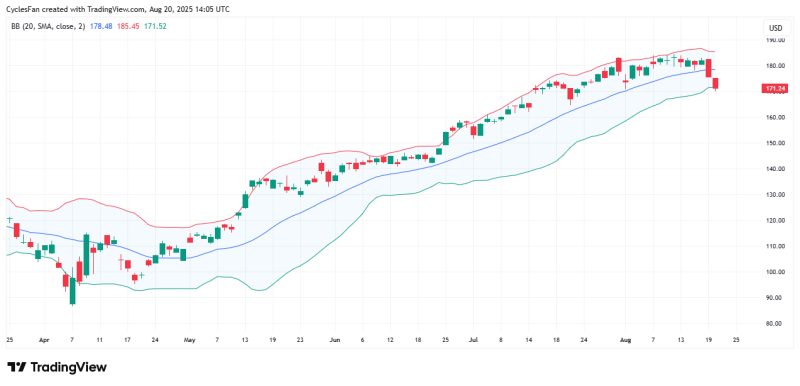
What makes this particularly interesting is how rarely NVDA touches its lower band. When dealing with a momentum stock like Nvidia, these technical touchpoints often serve as launching pads rather than breakdown points.
Earnings Catalyst Could Ignite NVDA Price Action
Here's where it gets exciting – Nvidia earnings drop on August 27, just one week away. The timing is perfect: oversold conditions meeting a major catalyst, which historically has been rocket fuel for NVDA.
If the stock holds above $171.24 support, traders are eyeing two upside targets. First stop: the middle band at $178.48 (4% bounce). If momentum kicks in post-earnings, the upper band at $185.45 comes into play – potentially an 8% upside move.
This setup has all the ingredients for a classic reversal: oversold technicals, key support test, and major earnings catalyst converging at once. It's exactly the kind of confluence that can either validate bears or completely flip the script for bulls.
 Usman Salis


