 Usman Salis

Amazon's having a rough patch. After touching $242 in the summer rally, the stock's been grinding lower and now sits around $228 - a classic case of what goes up fast can come down just as quick. The real story isn't the pullback itself, but what the charts are screaming about future weakness. Smart money is starting to see AMZN differently: not as a growth darling, but as the perfect hedge against broader market pain.
Technical Picture Getting Ugly
Trader Mike nailed it when calling this a tactical short hedge. It's not about Amazon being a bad company - it's about math and market mechanics.
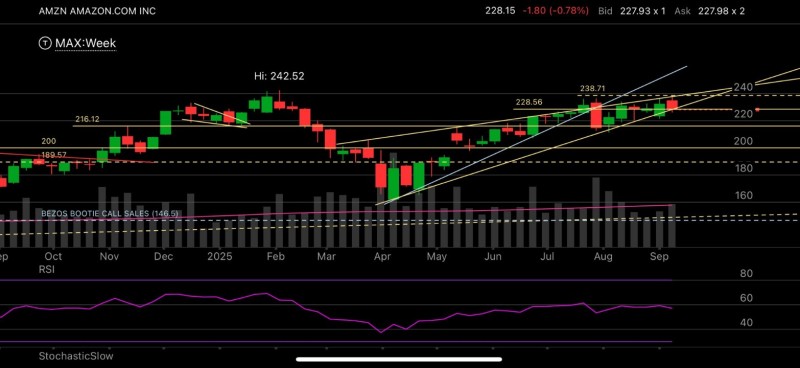
The weekly chart tells a story that bulls don't want to hear. Amazon's trapped in a rising wedge pattern - one of those formations that looks bullish but usually ends badly. Multiple attempts to break above $238-242 have failed miserably, turning what should be a breakout zone into a brick wall of resistance.
Key levels that matter:
- Resistance: $238.71 and $242.52 (the zones where dreams go to die)
- Support: $216.12 first, then $200 and $189.57 (where things could get interesting)
The momentum indicators are telling an even uglier story. RSI is rolling over, volume's been pathetic on rallies, and the whole structure screams "fake breakout waiting to happen."
Why Amazon Makes Perfect Hedge Sense
Here's the thing about using AMZN as a portfolio hedge - it hits all the right buttons. The stock's trading at ridiculous multiples that only work if everything goes perfectly. When markets get scared, expensive tech names like Amazon get hammered first and hardest. Add in weakening consumer spending and Fed uncertainty, and you've got a recipe for pain.
 Usman Salis


