Peter Smith

After months of sideways grinding, NIO's chart is finally showing signs of life. The Chinese EV maker is sitting at a critical juncture where technical patterns suggest something big might be brewing – and traders are starting to take notice.
NIO Price Tests Critical 20-Month Moving Average
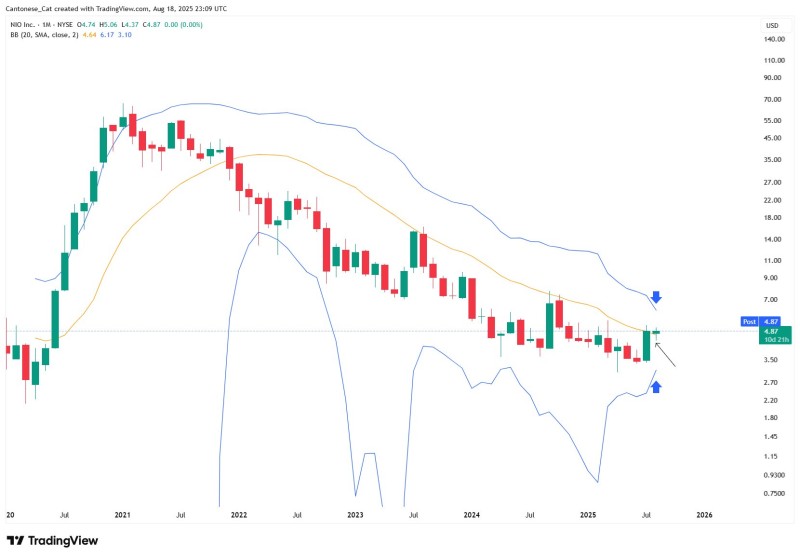
NIO stock is currently trading at $4.87, right in the thick of what could be its most important technical setup in months. The stock is battling to reclaim its 20-month Simple Moving Average around $6.17 – a level that's been acting like kryptonite for bulls.
Here's what makes this interesting: NIO is trading in a tight monthly range between $4.37 and $5.06, while the Bollinger Bands have squeezed down to a narrow corridor between $3.10 and $6.17. When you see this kind of compression, it usually means the market is coiling up for a significant move.
A savvy trader recently pointed out on X that this Bollinger Band squeeze on the monthly chart could be the calm before the storm. If NIO manages to flip that 20-month SMA from resistance into support, we could be looking at a legitimate trend reversal.
Bollinger Band Squeeze Signals Potential NIO Breakout
The monthly Bollinger Band squeeze is where things get really spicy. This pattern screams that volatility is about to explode – the question is which direction. Historically, these setups often precede the kind of moves that make or break portfolios.
Bulls are eyeing resistance levels around $6.00-$7.00 as the make-or-break zone. If NIO can punch through and hold above these levels, it could finally break free from the brutal downtrend that's been crushing the stock since its 2021 highs.
But here's the flip side: if the stock fails to gain traction here, that lower Bollinger Band support near $3.10 starts looking awfully attractive to bears. It's a classic high-stakes technical setup where the next few weeks could determine NIO's fate for months to come.
 Peter Smith