Peter Smith

Intel has been stuck in trading limbo since April, but that might be exactly what bulls want to see. The stock's been grinding sideways in a tight range, and according to Saúl Investings, this looks like textbook accumulation - the kind that often comes before big moves. Volume spikes, base-building, and repeated tests of support levels are all pointing to something brewing beneath the surface.
What the Charts Are Saying
The setup is pretty clean: Intel's trading inside a symmetrical triangle within a broader consolidation zone marked by that yellow box on the chart. Every time the stock dips toward support, buyers step in harder. Meanwhile, resistance at the top is getting tested more often - classic signs that a breakout might be coming. The moving averages are converging too, which usually means momentum is building up steam.
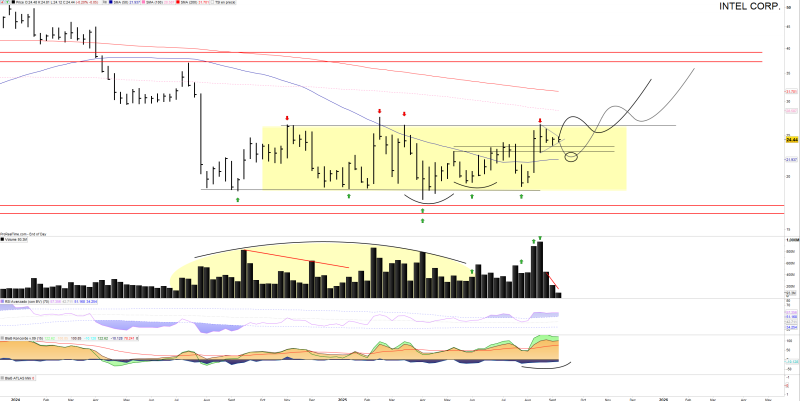
If Intel breaks above current resistance, the next stop could be $38 - that's the medium-term target everyone's watching. But if it fails here, expect another trip back to the bottom of the range before the next attempt.
Why This Matters Now
Intel's been working hard to reinvent itself while AMD and NVIDIA grab headlines. New product launches, AI chip development, and promises of better margins have kept institutional money interested. This whole accumulation phase we're seeing on the charts? That's likely big money quietly building positions before the crowd catches on.
The semiconductor space is brutal right now, but Intel's showing it can hang tough. The technical setup suggests patient investors might finally get rewarded.
 Peter Smith