 Saad Ullah

XRP is basically knocking on the door of a major resistance level at $3.41 right now. Breaking through this ceiling could unleash one hell of a rally. The charts are looking pretty bullish, with clear Fibonacci targets lined up like dominoes waiting to fall.
XRP's Make-or-Break Moment at $3.41
Right now, XRP is dancing just below $3.41, which happens to be that sweet 0.618 Fibonacci level on the weekly chart. One trader put it perfectly: "Once XRP breaks $3.41 — We fly to $4.53!" And honestly, the chart backs this up big time.
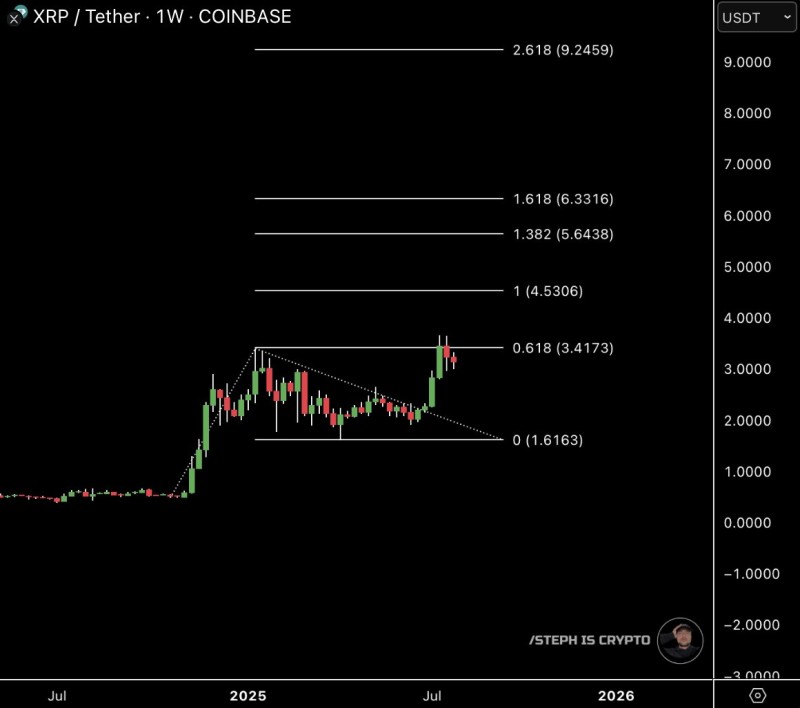
We're seeing XRP breaking out of a months-long downtrend with some seriously strong bullish candles pushing toward this resistance. If this momentum keeps up, that $4.53 level (the 1.0 Fibonacci) is looking like the next logical pit stop.
The Sky's the Limit: $6.33 and $9.24 in Play
But here's where it gets really interesting – if XRP smashes through $4.53, the technical roadmap shows even crazier upside potential. We're talking about the 1.382 Fib level at around $5.64, then $6.33 at the 1.618 extension.
The real moonshot target? That 2.618 level sitting pretty at $9.24. Yeah, that sounds nuts, but the breakout from this descending triangle pattern suggests XRP could really fly if the volume starts pumping. Sometimes the crypto market just goes absolutely bonkers, and this setup has all the right ingredients for one of those moments.
 Saad Ullah


