Saad Ullah

The meme coin king finds itself at a pivotal technical juncture as Dogecoin trades around $0.2100, having shed over 9% in the past week. This latest price action has brought DOGE directly to its weekly Kijun line, a critical support level that often determines the next major directional move. With volatility compression setting in and volume patterns shifting, traders are positioning themselves for what could be either a significant bounce or further deterioration.
DOGE Meets Weekly Kijun as Trader Highlights Market Fatigue
Dogecoin's recent descent has led to a direct confrontation with the weekly Kijun line at $0.2220, following a sharp decline that saw the token drop from highs of $0.2345 to lows around $0.2059. Market analyst @cantonmeow recently noted that DOGE has "revisited the weekly Kijun to tire everyone out," suggesting this technical level serves as more than just support - it's becoming a psychological battleground where market participants are being tested for conviction.
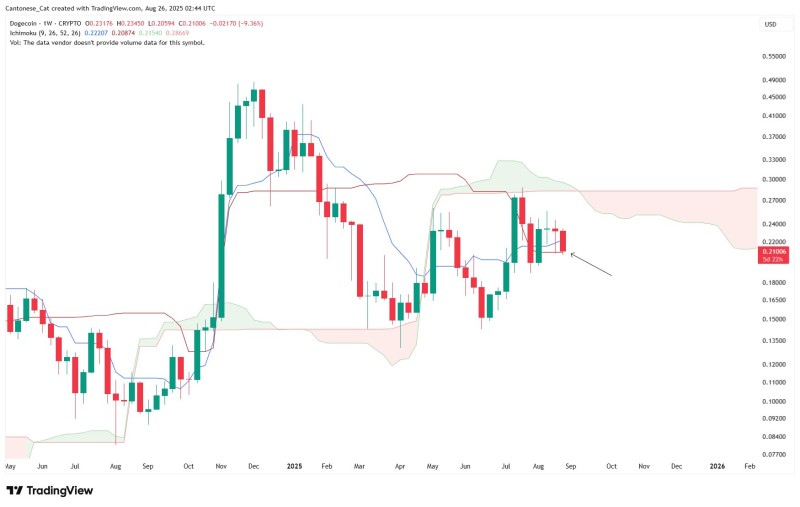
The Ichimoku cloud structure reveals diminishing momentum, with price action increasingly compressed around this critical technical threshold. Trading volume has remained relatively subdued during this consolidation phase, indicating that neither bulls nor bears have established clear dominance. This standoff typically precedes more decisive price movements as the market resolves its directional uncertainty.
Critical Levels Define DOGE's Next Chapter
The path forward for Dogecoin hinges on its ability to reclaim territory above the weekly Kijun at $0.2220. A sustained break and close above this level could catalyze a move toward the $0.2700-$0.3000 resistance zone, where previous supply walls have historically emerged. Such a scenario would likely coincide with renewed retail interest and increased social media momentum - factors that have historically driven DOGE's most significant rallies.
Conversely, failure to hold current support levels around $0.2050 could trigger a more substantial correction toward the $0.1800 area, where longer-term moving averages and previous consolidation zones might provide more robust support. The weekly cloud structure suggests that any breakdown below current levels would likely accelerate, as technical selling could compound with reduced retail participation during bearish phases.
 Saad Ullah