Nvidia's remarkable run may be hitting a speed bump. After months of impressive gains that carried the stock to highs near $184, NVDA has finally broken through a key technical level that many traders watch closely. This breakdown could signal the beginning of a more significant correction, making it crucial for investors to understand what levels matter most in the coming sessions.
NVDA Price Breaks Its Short-Term Uptrend
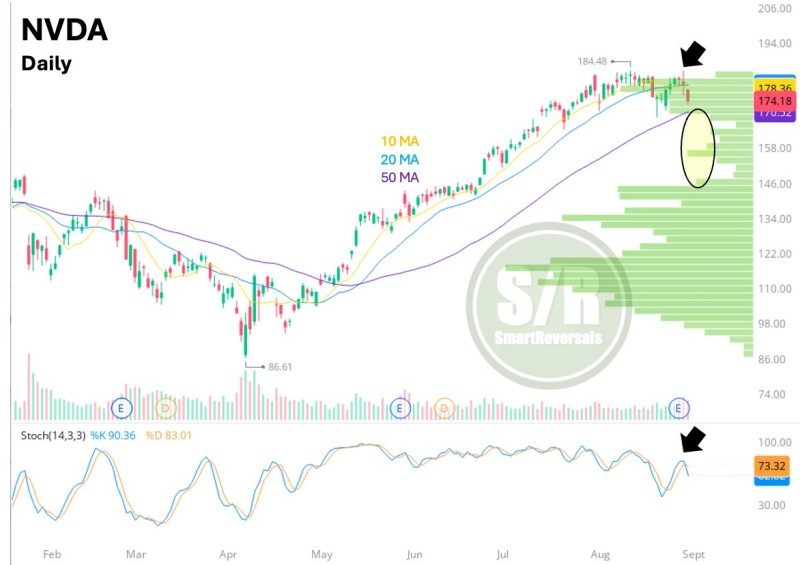
Nvidia has finally cracked below its 20-day moving average, ending a sustained period of bullish momentum. The stock's recent peak around $184.48 now feels distant as selling pressure builds. That decisive red candle isn't just noise—it shows real conviction from sellers and puts the uptrend in question.
Technical analyst @SmartReversals points to the next logical target: the 50DMA sitting around $170.32. With momentum indicators rolling over, there's a good chance NVDA tests this level sooner rather than later.

Here's where things get interesting—and potentially ugly. Below the 50DMA sits a volume gap between $158 and $146 where very little trading has occurred. These thin zones can be brutal if they break, creating air pockets where prices can fall quickly before finding buyers.
If NVDA can't hold the 50DMA, this gap zone represents the biggest risk for shareholders. It's the kind of technical setup that can turn a gentle pullback into a sharp correction.
What NVDA Needs to Recover
The bulls aren't out of the game yet. For Nvidia to regain its footing, it needs to close back above $177 on a daily basis. Getting above this level would ease immediate concerns and suggest the recent weakness was just healthy profit-taking.
Until that happens though, NVDA remains in a vulnerable spot. The technical damage is real, and it'll take some work to repair it.
Long-term investors might see any significant dip as a buying opportunity, especially given Nvidia's dominant position in AI and semiconductors. But timing matters, and waiting for technical confirmation could save some pain.
Nvidia sits at a technical crossroads. The break below the 20DMA and weakening momentum have set up a likely test of support around $170. If that level fails, the volume gap down to $158-146 could accelerate the decline.
The key level to watch is $177—reclaiming this area would suggest the weakness is temporary. Without that recovery, this could be the start of something more significant than just a routine pullback.
 Saad Ullah

 Saad Ullah


