SEI token finds itself at a crucial technical juncture as traders watch for confirmation of a potentially bearish reversal pattern. The cryptocurrency market often relies on technical analysis to predict price movements, and classic chart patterns like the head and shoulders formation can provide valuable insights into future trends.
SEI Price Under Pressure
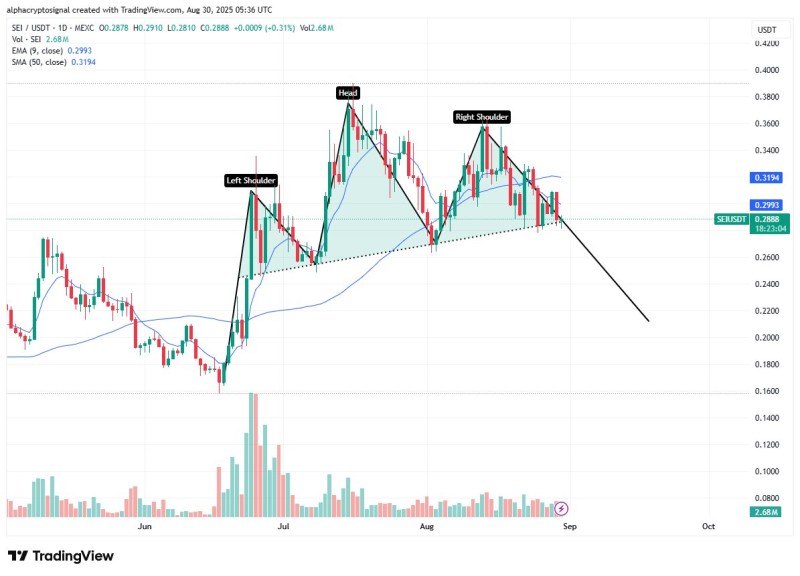
SEI is currently trading around $0.2888 with a small daily increase of 0.31%, but this modest gain masks underlying technical weakness. Market analyst @alphacryptosign has identified a head and shoulders pattern on SEI's daily chart - a well-known bearish signal that often precedes significant price drops.

The token now sits at its neckline support, a make-or-break level that will likely determine whether SEI can stabilize or faces further decline.
The technical picture looks challenging for SEI bulls. The token trades below both its 9-day EMA at $0.2993 and 50-day SMA at $0.3194, indicating bearish momentum is currently in control.
If the neckline breaks, SEI could drop to the $0.22-$0.20 range. However, if buyers step in to defend current levels, the token might bounce back toward $0.30-$0.32. Only a clear move above the moving averages would signal the bearish scenario is off the table.
Outlook for SEI Traders
As the analyst noted, there's no rush to act until the pattern confirms. A daily close below the neckline would create short-selling opportunities, while a failed breakdown could catch sellers off guard and trigger a temporary rally.
SEI is at a critical decision point. Traders should monitor the token closely, as the next few trading sessions will reveal whether this head and shoulders pattern delivers the expected bearish outcome or gets invalidated by buyer support.
 Usman Salis

 Usman Salis


